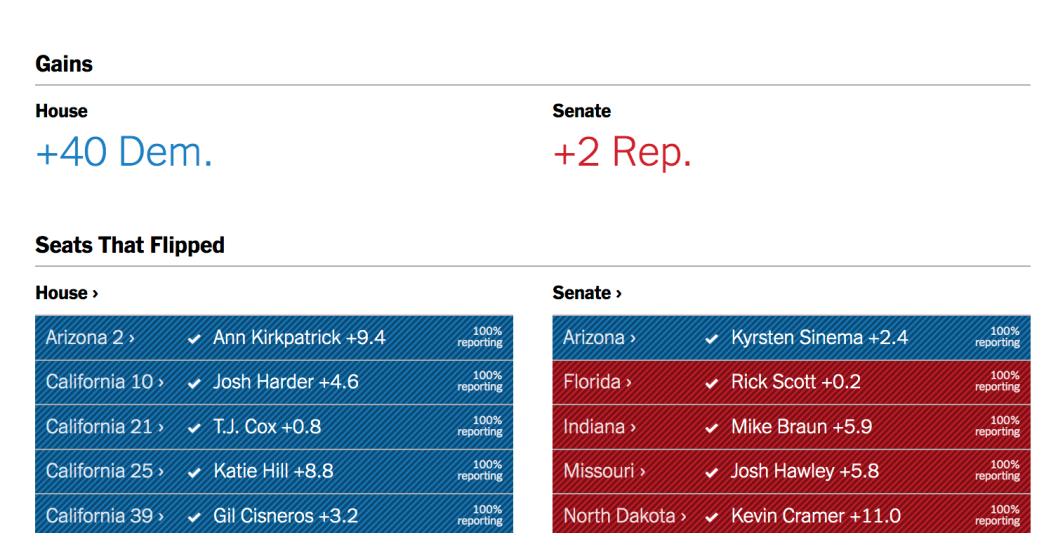
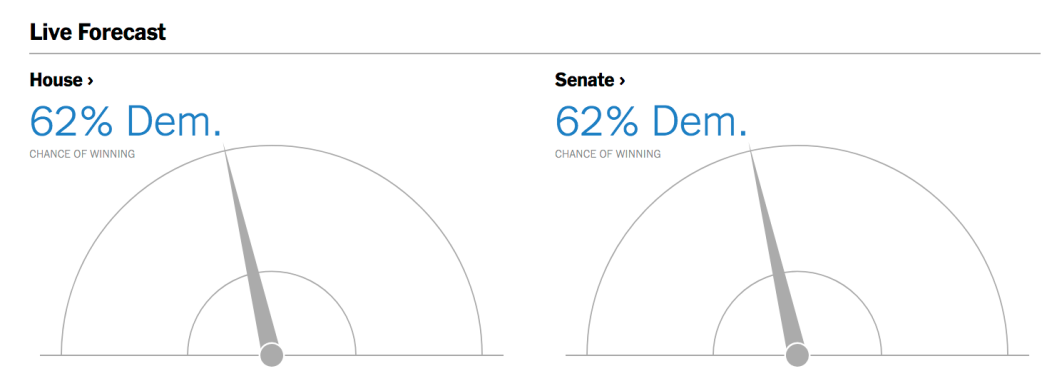
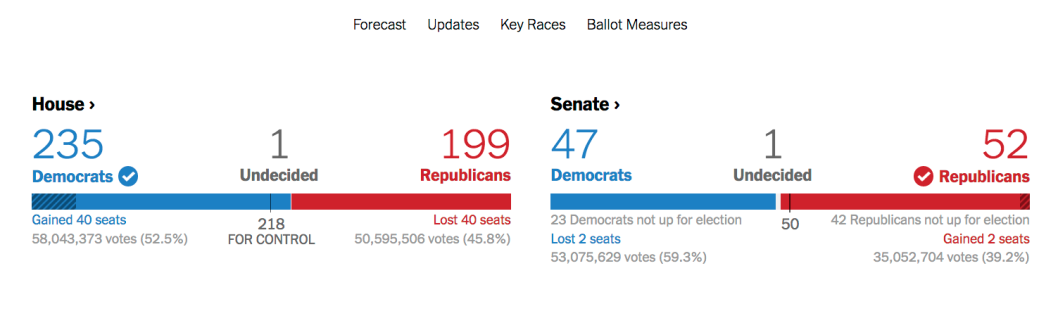
This is a map developed by the New York Times for the 2018 midterm elections. The map was posted and updated live as the results came in, along with supplemental charts for each candidate and each state. Categories ranged from ‘races we’re watching now’ (which was updated live); gains; seats that flipped; analysis from New York Times Reporters; as well as issues on the ballots of states. The overall web page was extremely detailed with many different charts and diagrams, though there was no actual map for this project; the polling data was made into different visualizations.